How biological age and aging speed are computed.
The methodology rests on patterns within locomotor activity — not raw step counts, which are too noisy on their own. The patterns examined are intensity transitions, duration of sustained activity, recovery cadence between bouts, and perpetuity of activity over weeks. These have been shown in peer-reviewed work to correlate with biological age, mortality risk, and chronic-disease incidence.
Biological age
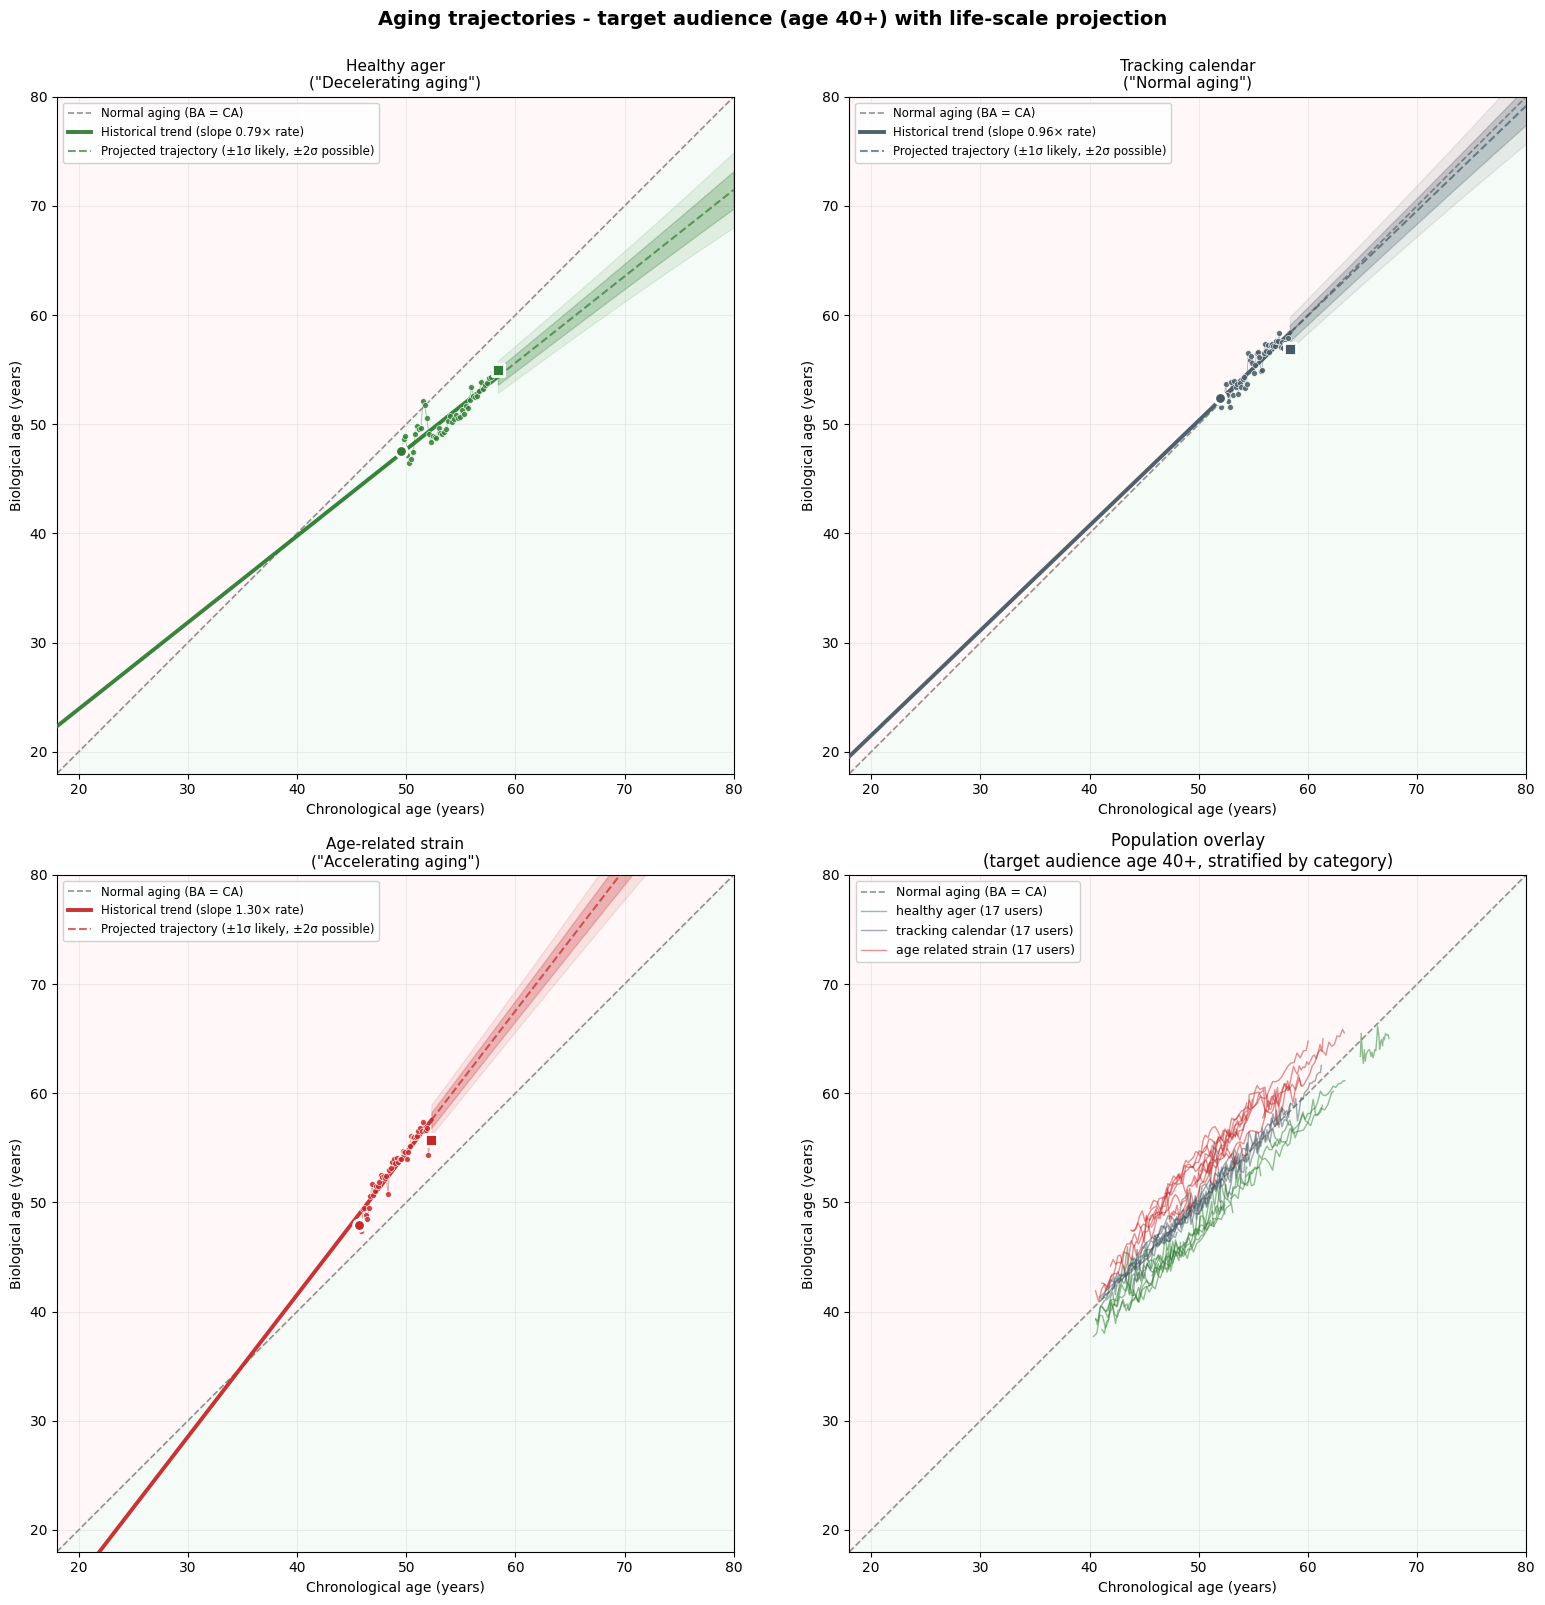
A 50-year-old can have a biological age of 45 (slower aging, in better physical condition than the average 50-year-old) or 56 (faster aging, accumulated wear and tear). Biological age is a slow-moving indicator: it changes over weeks and months in response to sustained patterns of activity, recovery, stress, and lifestyle.
Aging speed
The signed gap, in years, between biological and chronological age. Positive values mean the body is running ahead of the calendar; negative values mean it is running behind. Aging speed is not read off a single day — it is derived from a long-term trend in the BAA signal, so day-to-day noise does not move it. Sustained patterns of activity, recovery, and stress do. The result: a person who begins exercising regularly, sleeping better, or managing stress will see aging speed bend first; biological age, the integrated quantity, follows over months.
- 0biological age tracking chronological — body keeping pace with the calendar
- +4biological age four years ahead of chronological — body has accumulated more wear than the calendar suggests
- −3biological age three years behind chronological — typically the result of sustained positive lifestyle patterns
Why locomotor activity
Three properties make locomotor activity the right input class:
Modern smartphones record steps and movement continuously, with no additional hardware, sensors, or appointments required.
A blood test or DNA assessment is a snapshot. Locomotor data accumulates daily, automatically, capturing patterns of activity, intensity, recovery, and consistency. The indicator improves with the length of the record.
The algorithmic foundation has been validated against external biomarkers — DNA methylation clocks, blood-based markers, and other clinical inputs — with consistent agreement across the methods.
Aging trajectories — what the output looks like
Each user has a biological-age trajectory plotted against chronological age. The vertical distance from the diagonal is aging speed in years at that age; the slope of the line shows whether that distance is widening, holding, or narrowing over time. Three categories emerge in the target audience (age 40+):
Financial projection layer
The financial-projection model computes retirement projections from a small set of inputs the user provides — current savings, planned contributions, expected investment return, target retirement age, payout scheme — combined with publicly available actuarial statistics and information about retirement products.
The model is intentionally transparent. A user, advisor, or provider analyst can inspect each input, follow the calculation, and see how the output changes when an assumption changes. There is no opaque black box; there is no hidden parameter.
Current limits
The model is intentionally simple at present:
- ·Inflation is not yet modelled separately from the return assumption
- ·Contribution-growth profiles are not yet user-configurable
- ·Family and household plans are not yet supported
These are deliberate simplifications that keep the model accessible, easy to explain, and easy for non-specialist users to interrogate. The model is on a clear path of progressive sophistication, including through future integrations with retirement-product providers.
Read the publications.
Six peer-reviewed papers underwrite the methodology. Each entry on the publications page has a one-line takeaway.